Is Your Customer Satisfaction Report Lying To You?

Most retailers leverage their POS receipts to have customers fill out satisfaction surveys. In fact, it is almost impossible to find a retailer that doesn't have some kind of survey contest on their receipts: from traditional retailers, to gas stations, to restaurants, these surveys are everywhere. The problem is that none of the data is useful; in fact, it is often counter-productive, analytical voodoo.
The reason is that these surveys inherently suffer from a huge bias. They are only filled out by customers that bought at the store, not the 40% to 65% of store visitors that did not buy and so didn't get a receipt with a survey link on it!
The CEO of one of our clients said it best when he asked "how come whenever a competitor's store opens up my customer satisfaction scores go up?" The reason is that his mix of customers changed. Marginal customers no longer make purchases at his store, they've moved on to the competitor, and therefore do not fill out surveys. The new mix of customers contains a higher proportion of core customers, those that were very happy with the retailer to begin with, and less marginal customers, making the average customer satisfaction score higher!
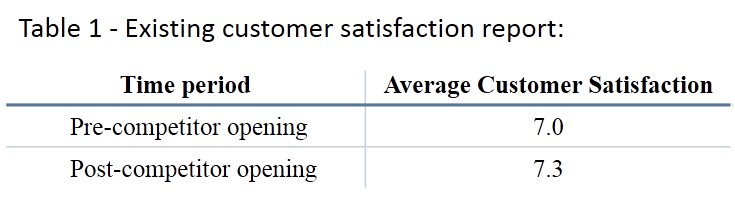
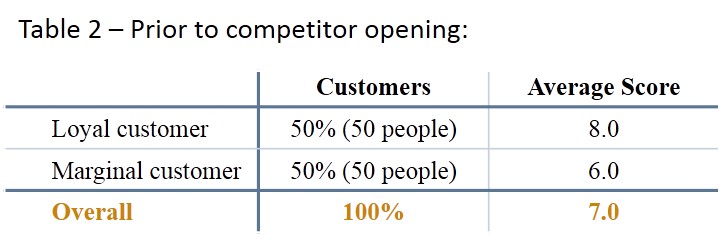
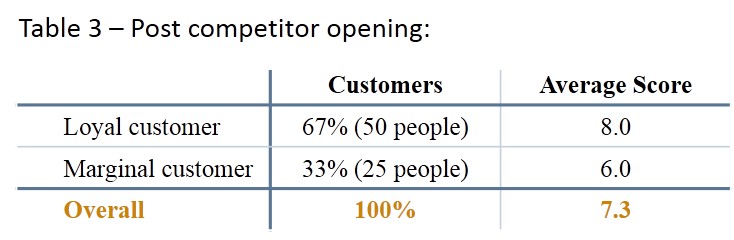
Table 1 is an illustration of what our client saw.The implication drawn from the report was that the initiatives to blunt the competition were working. But is it true? Did customer satisfaction go up due to activities the retailer did to blunt the new competitor opening? When we dived deeper here is what we found: Prior to the competitor opening, the store had 100 customers (results indexed to 100 customers), 50 of them were loyal customers and 50 of them were marginal customers. As a result, the overall customer satisfaction score was 7. Results shown in Table 2.
After the competitor opening, the 50 loyal customers remained loyal, but 25 of the marginal customers left to go to the competition. So the new mix of customers in the store filling out the POS surveys were 50 loyal and 25 marginal. As a result, the overall customer satisfaction score jumped to 7.3, but only because the store lost 25 customers! See Table 3.
In fact, customer satisfaction was flat, what was changing was the mix of customers, giving quite different implications. Without significant consideration customer satisfaction reports often imply the wrong insights. This situation is happening every day in retail. In many ways the move to more data in retail has reduced executive visibility, as it has created a fog of misinformation about what is really happening in their stores.
We have found that the opposite is also true, as a retailer improves their brand consideration there are more new customers in the stores. A new customer almost never scores a retailer as well on satisfaction as existing, loyal customers. New customers might eventually become loyal, but initially they are just testing your store. As a result, they still have many questions about you and are likely to default to rating your store a 5 or 6 out of 10 on a 10 point satisfaction scorecard. Thus, the new customers push the average blended customer satisfaction score lower, implying customer experience is in decline, when in fact the only thing changing is the new/loyal customer mix ratio.
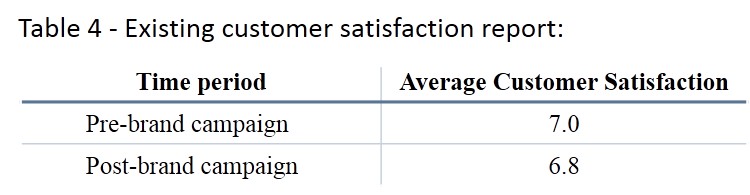
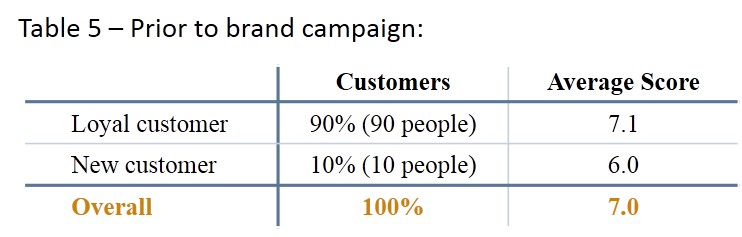
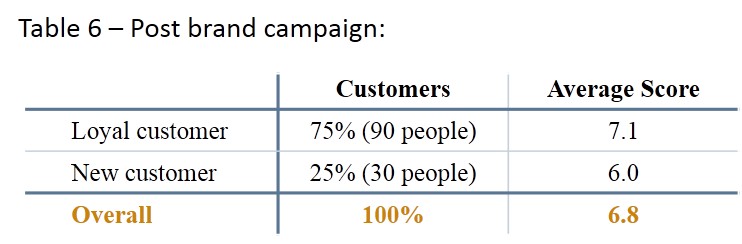
Table 4 shows what we found with a client engaged in a highly successful brand campaign when they couldn't figure out why their POS survey was telling them customer satisfaction was dropping. They began to question their branding initiative - with dropping satisfaction scores, was now a good time to focus on bringing new customers to the store? They wondered if instead they should focus on fixing the decline in customer experience first, then advertise.
But is this report accurate? Did customer satisfaction go down because customers were becoming unhappy with their in-store experience? The results we found when we did the analysis properly are in Table 5.
After we put the new analysis in place the right insight became clear. The brand campaign was working, the in-store experience & satisfaction were unchanged and the mix of customers was changing as expected, don't panic and keep it up!
So what is the solution? We recommend three things:
- Turn off your POS led customer satisfaction survey today! There are great ways to leverage a POS survey but this isn't one of them. Customer satisfaction surveys need to sample everyone that enters your stores, not just those that buy.
- Fuse and triangulate your data sources. Insight is only correct if you are isolating each independent variable, revealing how each component of your business (store trade area, branding, traffic driving, in-store experience & conversion) is doing. Chances are, if you are examining the sales lift of your last flyer without factoring in your brand strength, or looking at your in-store experience scores in insolation of other variables, then all you are seeing is noise.
- Think deeply about each issue, many people think analysis is just crunching the numbers. Correct knowledge is much more nuanced. It is not about doing math (anyone can do math when the formula is given!), it is about asking the right questions, getting deep into the numbers and coming to considered conclusions.