Is Your Real Estate Keeping Up With The Changing Landscape?
Moving from store centric to consumer centric analytics.

Real estate is in flux in Canada. Target is opening 120+ stores in Canada, major competitors like Walmart continue to aggressively expand their store count, e-commerce and cross-border shopping have hit new levels and Canada continues to urbanize and become more ethnic.
The changing environment is producing challenges but also opportunities for smart, fast-moving retailers. Most successful retailers have always been about understanding the consumer, with street smarts on how consumers shop and the implications for store counts, locations and formats. The issue has been their analytical data and software has always let them down.Most retailers would describe their real estate modeling as "drawing a circle around a store". The analytical lens is from the point of view of the store, not the consumer - it is "store-centric" modeling. The latest approach in real estate analytics is therefore a giant leap forward, moving from "store-centric" to "consumer-centric".
Consumer-centric analysis looks at decisions from the lens of the consumer. In real estate, this means taking a viewpoint from all 812,000 postal codes in Canada. Instead of just one drive time rule and a trade area for each store think of it as having 812,000 drive time rules - a 10,000% increase in analytical horsepower.
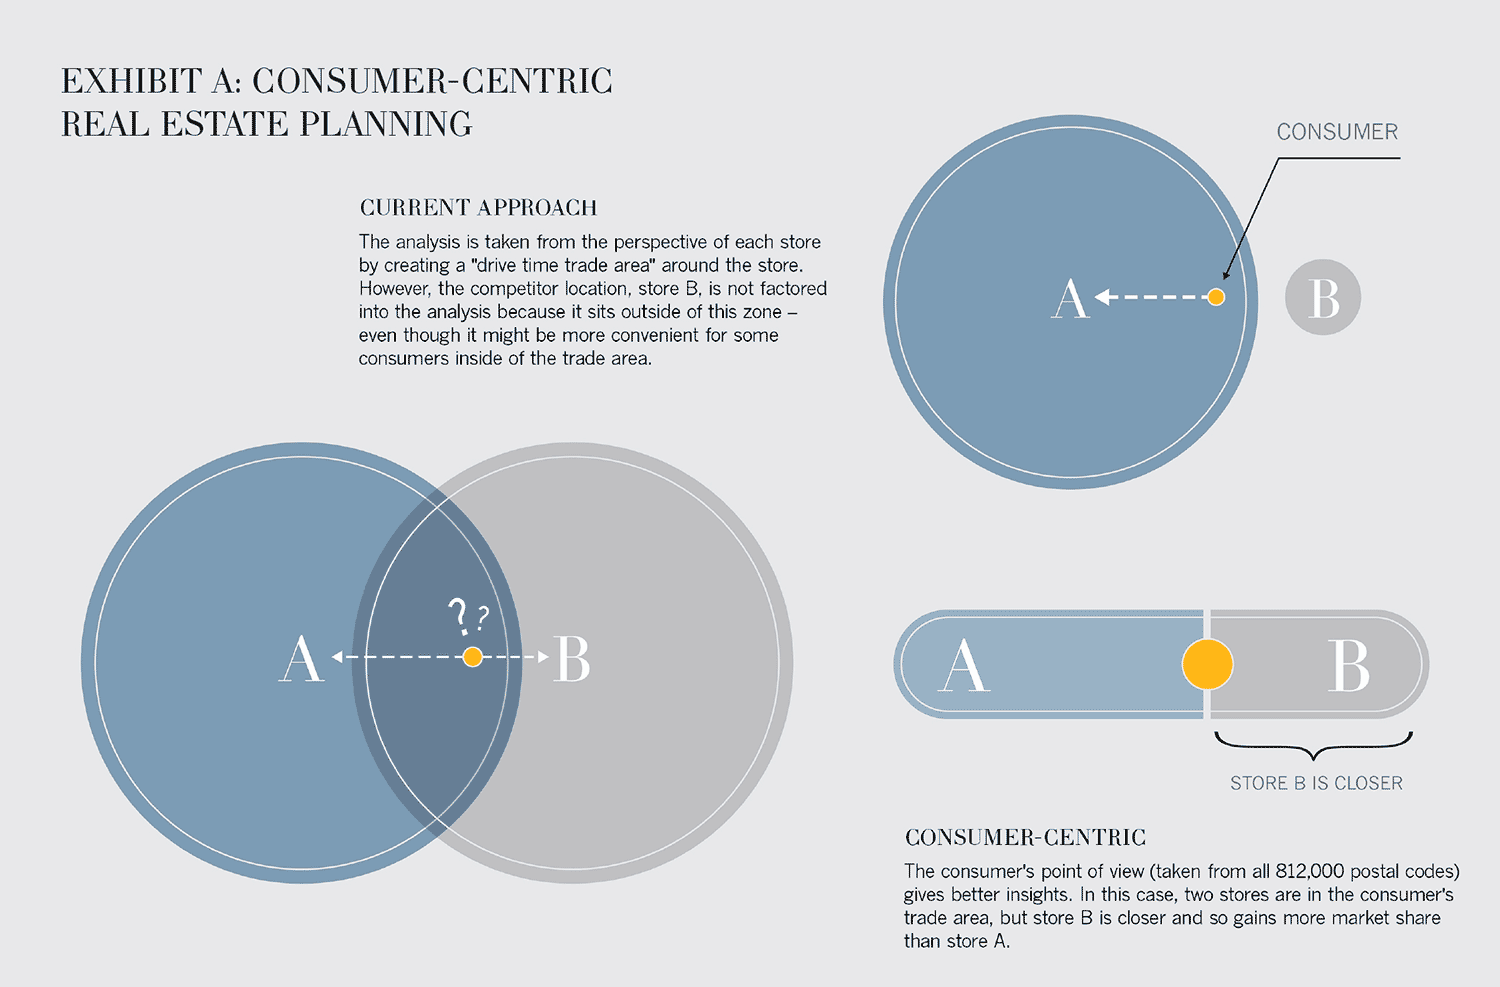 
Each postal code’s drive time rule is uncovered by looking at the relative distance between that postal code and all nearby stores - not just your own. Consumer behaviour is not driven by absolute rules like "20 minute drive to the store". If a consumer lives in the countryside and the nearest Loblaws store is 50 minutes away, but the nearest Sobey’s is 60 minutes away, then all else being equal Loblaws will gain more share from that postal code. Compare this to a situation where a consumer is only 20 minutes away from a Loblaws store but 5 minutes away from a Sobey’s. In this case, even though Loblaws is very close, it is at a "drive time" disadvantage and will gain less share than Sobey’s from this postal code.
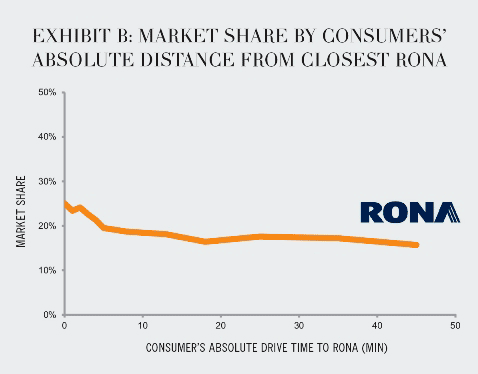
While this insight may be obvious when stated, many retailers continue to use absolute drive times to evaluate store opportunities. Here is what the absolute drive time looks like for RONA (see exhibit B below).
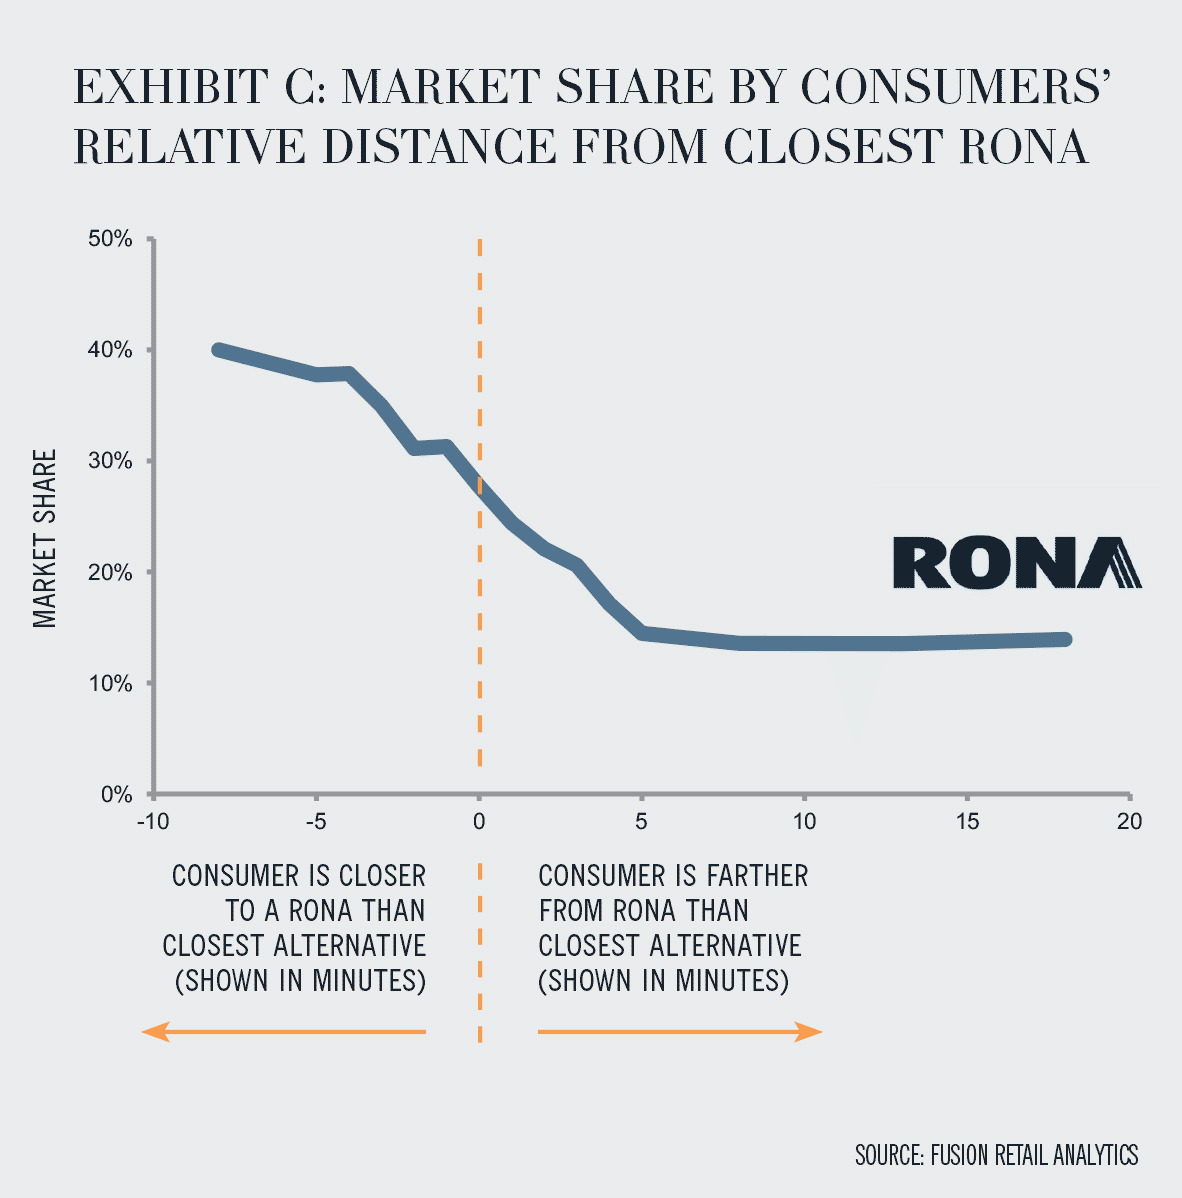
Here is what their relative distance drive time looks like (see exhibit C below). When looking at relative distance, we begin to see the true gaps in market share and can start to get to dramatically higher-ROI insights through analytics on store count, locations and formats.
Using relative distance, it becomes possible to determine your current market share with a particular postal code and how much higher it would be if you relocated a store 5 minutes closer, 10 minutes closer, 20 minutes closer and so forth. With relocations costing big box retailers several million dollars, it pays to be accurate.
To calculate the impact of relative distance you must first map the distance of each postal code to each of the stores in your network as well as the distance to each of your competitors’ stores. The relative distance is then determined by taking the distance between each postal code and your closest store, minus the distance of the closest competitor, for each major category you compete in. The analysis has to be done at the category level because different categories have different competitors and therefore different relative distances. The calculation power required is immense. Let’s say you compete in 5 major categories with 80 stores, and your competitors have 420 locations between them. Across 812,000 postal codes that works out to more than 2 billion distance calculations. The end result is an extremely granular and accurate understanding of real estate locations, which was not possible to this extent even a few years ago.
After modeling all of the relative distance combinations, the next step is to uncover the market share for each postal code. There are a couple of ways to do this: through a postal code harvest, through loyalty data (assuming it is capturing at least 70% of your sales!) or through a robust survey.
This data provides the basic foundation needed to map out the market share decay curve, which will visually show the relationship between relative distance and market share. As you build your model you will be able to learn how your market share declines based on relative distance, by category, against different kinds of competitors, for different retail formats, giving you the tools to make incredibly powerful decisions on optimal store count, exact store locations and store format options. Today, most real estate analytics is done piecemeal, store by store - it’s like looking at a few trees at a time and never the whole forest. But with the model we just walked through, your team has the ability to look at your full real estate portfolio all at once and know precisely where the network has holes.
RONA is a textbook example of guessing vs. leveraging analytics when it comes to real estate planning. In 2011 RONA announced that they were downsizing their big-box stores in Ontario to a medium-box format - a mistake waiting to happen, based on what our models were saying. In postal codes where RONA is relatively closer than a competitor, they get 24% market share, regardless of whether it is a big-box or medium- box store. However, in postal codes where RONA is 15 minutes farther away than the closest competitor, RONA’s market share decays by an additional 2% more in medium-box stores than in big-box stores. When RONA was more than 15 minutes away, the gap between big- and medium-box share increased to 4%.
Before RONA even made their move, the key insight that we uncovered for our clients was that a medium-box RONA store has dramatically less drawing power than a big-box store - they are walking into disaster. It took RONA 18 months and several million in lost sales before they realized their mistake. That is the power of consumer-centric analytics. I suppose that I’m a bit biased, but I have always struggled to understand why a retailer would rather waste several million to learn what $100K in great analytics already knows. What I do know is that retailers with access to our analytics love the fact they know more about the competition than the competition knows about themselves.